Natural language processing
I rebuilt a hate speech classifier with five models and a tool for trying your own sentences. It sorts text into hate speech, offensive language, or neither, then shows how the models voted and which words influenced the result.
Scripted examples
This movie had a terrible ending.
Four parts of the problem
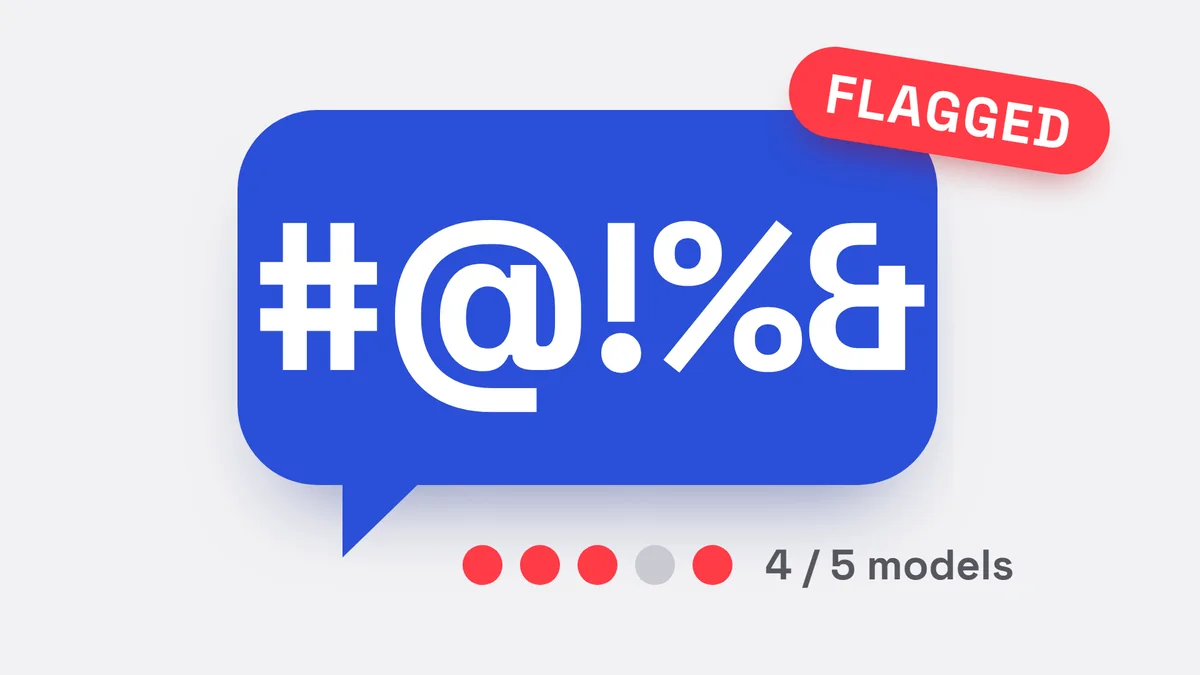
The app compares Naive Bayes, SVM, Logistic Regression, a Decision Tree, and SGD. Three of them vote on the final label. I show their individual results too, so you can see when they disagree.
This chart is illustrative. The repo uses 19,826 labelled tweets, with offensive language making up about 77.6% of the data.
I kept the original project’s cleaning rule: lowercase the text, remove mentions, and replace punctuation with spaces. It has a flaw: links leave fragments behind. Those fragments can end up influencing a prediction.
@critic_92 that ending was GARBAGE 😤 honestly http://t.co/9fA2
This simplified animation keeps emoji and removes the whole link; the repo’s cleaning rule does neither. Select the line to replay it.
On the repo’s test split, the voting model gets 89.84% accuracy but catches only 31.3% of hate speech examples. That gap matters more than the headline score. The controls below are a separate illustration of class weighting.
0.09 illustrative recall
The rebuild also compares regular and class-weighted Logistic Regression. Weighting catches more hate speech, but overall accuracy drops. This slider uses simulated values to let you try that trade-off; the measured results are in the repo.
Illustrative values, calculated in the browser. A real threshold needs to be chosen against labelled evaluation data.
The original app retrained its models on every prediction request. I moved training out of that flow and shipped the fitted weights with the rebuild. That makes it much quicker to try a sentence, but it still reads word counts and misses context. The examples on this portfolio page are scripted; the repo contains the working classifier.
A label alone does not help a moderator; they need to see why text was flagged.
19,826 labelled tweets, about 77.6% offensive, so the classes are badly imbalanced.
Type your own sentence, watch five models vote, and see which words moved the result.
Naive Bayes, SVM, Logistic Regression, a Decision Tree and SGD, with three voting on the label.
89.84% accuracy hid that only 31.3% of hate speech was caught; the headline number can mislead.